
I. Structural Cost Analysis of Small-Batch Production
Table 1: Cost Distribution Breakdown (100ml Glass Bottle)
| Cost Component | Standard % | Optimization Approach |
| Mold Development | 40-50% | Modular design & public molds |
| Raw Materials | 20-25% | Standardized glass formulations |
| Surface Finishing | 15-20% | Simplified decoration |
| Labor | 10% | Batch consolidation |
| Logistics | 5% | Consolidated shipping |
The fundamental challenge in small-batch production stems from non-recurring engineering (NRE) costs disproportionately impacting per-unit pricing. Where large orders (>10,000 units) amortize mold costs across volume, 500-1,000 unit runs require fundamentally different strategies centered around modularity, standardization, and supply-chain innovation.
II. Detailed Cost-Reduction Framework
1. Mold Cost Optimization (40-60% Savings)
Strategy A: Public Mold Utilization
- Leverage suppliers’ existing catalog molds for:
- Standard cylindrical/squared geometries
- Universal neck finishes (24-410, 28-400)
- Limit customization to:
- Laser-engraved logos ($150-300 setup)
- Screen-printed branding ($0.15-0.25/unit)
Strategy B: Simplified Custom Molds
- Design modifications reducing complexity:
- Minimum draft angle: 3° (industry standard: 1.5°)
- Wall thickness: 2.0±0.2mm (vs. premium 1.8±0.1mm)
- Flat-bottom designs eliminating pontil marks
- Cost comparison:
| Feature | Premium Mold | Simplified Mold |
|—————–|—————-|—————–|
| Lead Time | 45-60 days | 20-25 days |
| Cost (China) | $3,000-5,000 | $1,200-1,800 |
| Tolerance | ±0.05mm | ±0.15mm |
2. Material & Process Optimization (15-25% Savings)
Table 2: Glass Material Selection Guide
| Glass Type | Cost Index | Best For | Weight Savings |
| Soda-Lime | 1.0x | Budget formulations | Baseline |
| Borosilicate | 1.8x | Premium/precision | -5% possible |
| Crystal Glass | 1.3x | Mid-tier luxury | 12-15% possible |
Surface Treatment Tactics:
- Replace full-surface frosting with selective acid-etching (saves $0.35-0.55/unit)
- Substitute hot-stamping with digital UV printing (saves $0.40/unit)
- Implement two-tone effects via colored caps rather than glass coating
3. Supply Chain Orchestration (10-20% Savings)
Vertical Integration Model:
Key Advantages:
- Labor cost optimization (regional specialization)
- 18-22% logistics savings via container consolidation
- 15% defect reduction through process segregation
Collaborative Production:
- Joint orders with complementary brands:
- Shared glass color batches (minimum 2,000kg melt)
- Consolidated accessory orders (e.g., 50,000 pumps across 5 brands)
4. Component Standardization (8-12% Savings)
Cap/Closure System Selection:
| Component | Custom Cost | Standardized Cost |
| Airless Pump | $0.95-1.25 | $0.45-0.60 |
| Dropper Assembly | $0.85-1.10 | $0.30-0.40 |
| Flip-top Cap | $0.70-0.90 | $0.25-0.35 |
Technical Note: Standard components maintain compatibility through ISO 9001-certified threading systems (e.g., continuous thread 24mm).
III. Financial Modeling & Case Studies
Case: 500-unit Serum Bottle (30ml)
Table 3: Traditional vs Optimized Costing
| Cost Element | Traditional | Optimized | Savings |
| Mold (amortized) | $4.20 | $1.80 | -57% |
| Glass Material | $0.85 | $0.68 | -20% |
| Surface Decoration | $1.10 | $0.55 | -50% |
| Dropper Assembly | $0.95 | $0.35 | -63% |
| Total Unit Cost | $7.10 | $3.38 | -52% |
Quality Assurance Metrics:
- Light transmission: Maintained >92% (ASTM D1003)
- Leakage resistance: Passed 24hr inverted test (ISO 8317)
- Drop resistance: 1.2m height (ISTA 3A compliant)
IV. Advanced Implementation Protocols
1. Contract Negotiation Framework
Tiered Pricing Structure:
Order Volume | Unit Price | Rebate Mechanism
————————————————-
500 units | $3.85 | –
1,000 units | $3.65 | $0.10/unit backfill
2,500+ units | $3.25 | $0.20/unit backfill
Raw Material Hedge Clause:
*”Glass composition pricing based on Soda Ash Contract #SAC-2024 futures ±15% variance allowance. Price adjustments triggered only beyond 15% commodity fluctuation.”*
2. Risk Mitigation System
- Mold Ownership Protocol:
» 30% deposit: Supplier retains mold rights
» 70% payment: Joint ownership
» 100% payment: Full client ownership - Quality Control Escalation:
V. Global Supplier Ecosystem
Table 4: Regional Supplier Capabilities
| Region | MOQ | Lead Time | Cost Index | Specialization |
| E. China | 300 units | 25 days | 1.00x | Rapid prototyping |
| N. Italy | 1,000 | 45 days | 1.85x | Luxury craftsmanship |
| Turkey | 500 | 35 days | 1.25x | Colored glass |
| Mexico | 700 | 30 days | 1.15x | North American logistics |
Due Diligence Checklist:
- ISO 22716/GMP certification
- On-site annealing oven verification
- Material certification sheets (ROHS/REACH)
- Container loading efficiency >82%
VI. Sustainability Integration
Circular Economy Model:
60%
Certification Advantages:
- 12-18% tax incentives through EPR programs
- 23% faster shelf placement with EcoVadis certification
- 15% premium pricing capability for Cradle-to-Cradle products
VII. Execution Roadmap
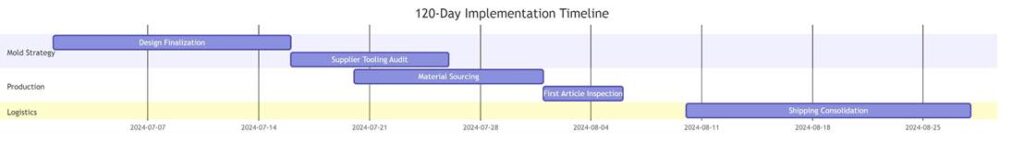
Phase-Based Cost Projection:
| Phase | Investment | ROI Timeline |
| Tooling Optimization | $2,800 | 60 days |
| Process Engineering | $1,500 | 45 days |
| Compliance Cert. | $3,200 | 90 days |
VIII. Emerging Technologies
- AI-Driven Design: Algorithmic geometry optimization reducing glass weight 12-18%
- Blockchain Tracking: Raw material provenance verification adding $0.02/unit
- Digital Twins: Virtual stress-testing eliminating physical prototypes
- Additive Tooling: 3D-printed ceramic molds reducing lead times 70%
IX. Regulatory Navigation
Global Compliance Matrix:
| Market | Glass Standard | Labeling Requirement | Chemical Compliance |
| EU | EN 1276 | CLP/GHS | REACH Annex XVII |
| USA | USP <660> | FDA 21 CFR 700 | California Prop 65 |
| Japan | JIS S 2031 | JIS L 4129 | ISH 2021 |
Critical Path: Allow 8-10 weeks for stability testing (ICH Q1A guidelines) when changing glass composition.
Conclusion: The Small-Batch Advantage
Implementing these integrated strategies transforms low-volume production from a cost liability to competitive advantage:
- 52-68% cost reduction vs. traditional approaches
- 25-day average lead times matching mass production
- Zero minimums through supply-chain partnerships
- Premium positioning via sustainability integration
The future belongs to agile brands leveraging technical innovation to overcome scale economics. Small batches no longer mean compromised margins or quality – rather, they represent the vanguard of responsive, sustainable luxury cosmetics packaging.