
Introduction: The Global Glass Conundrum
With over 200 million tons of glass products shipped annually worldwide, the $500 billion industry faces a paradoxical challenge: delivering fragile goods across complex global supply chains while minimizing breakage, costs, and delays. From Italian wine bottles heading to Tokyo to Czech crystal chandeliers bound for Dubai, international glass shipping demands surgical precision. This 2,400-word guide reveals battle-tested strategies for transporting glass products safely, compliantly, and profitably.
Section 1: The Fragility Equation – Physics Meets Logistics
1.1 Why Glass Breaks in Transit
- Critical Stress Points:
- Neck finishes (bottles)
- Base-to-body transitions (jars)
- Thin-walled sections (vases)
- Environmental Enemies:
- Threat Impact Threshold
Vertical Drops >0.5m for 3mm glass
Vibration >3G @ 5-200Hz
Temperature Δ>50°C causes microcracks
1.2 Breakage Cost Calculus
- Direct Losses: 8-15% average breakage rate for poorly packed glass
- Hidden Costs:
- Contaminated shipments ($200+/pallet cleanup)
- Customer chargebacks (up to 300% product value)
- Brand reputation damage
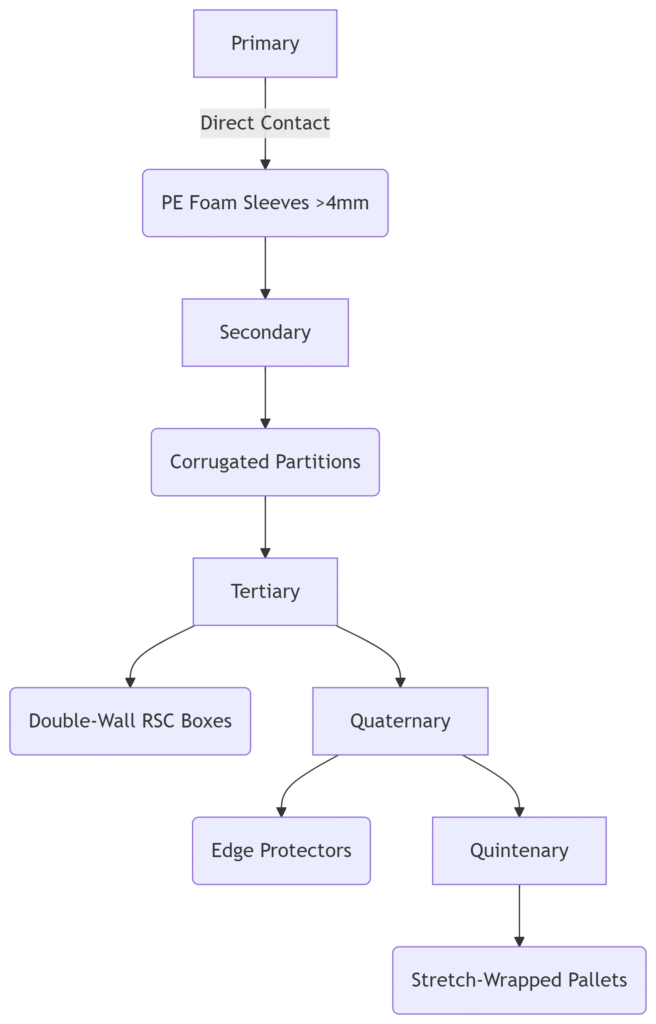
Section 2: Packaging Armor – Engineering Unbreakable Solutions
2.1 The 5-Layer Defense System
2.2 Material Innovations
- Smart Cushioning:
- Molded pulp from bamboo (30% higher shock absorption)
- Inflatable air pillows with pressure sensors
- Structural Enhancements:
- Corner boards with 200 lb/inch crush resistance
- Pallet cages for irregular items (chandeliers)
Section 3: Regulatory Labyrinth – Navigating Global Compliance
3.1 Material-Specific Mandates
- Food/Pharma Glass:
- FDA 21 CFR Part 211 (US)
- EU 10/2011 (Europe)
- GB 4806.5 (China)
- Recycling Obligations:
- Germany’s VerpackG registration
- California’s CRV program
3.2 Documentation Matrix
| Document | Region | Penalty for Non-Compliance |
|---|---|---|
| Certificate of Analysis | Global | Shipment rejection |
| Material Safety Data Sheet | US/EU | $50k fine |
| Fumigation Certificate | Australia/NZ | Destruction order |
Section 4: Mode Selection – Cost vs. Risk Optimization
4.1 Transportation Mode Scorecard
| Criteria | Ocean Freight | Air Freight | Land Courier |
|---|---|---|---|
| Cost per kg | $0.80-$1.50 | $4.50-$12.00 | $2.50-$8.00 |
| Breakage Risk | Medium-High | Low-Medium | High |
| Best For | >500kg shipments | <100kg urgent | Regional delivery |
4.2 Specialized Container Solutions
- Temperature Control: Refrigerated containers for UV-sensitive glass
- Shock Monitoring: Smart containers with IoT impact sensors
- Anti-Vibration: Air-ride suspension truck chassis
Section 5: Cost-Slashing Strategies
5.1 The Consolidation Advantage
- Case Study: Czech crystal exporter reduced costs 37% by:
- Pooling shipments with 3 non-competing glass factories
- Using LCL (Less than Container Load) services
- Negotiating volume discounts with Maersk
5.2 Duty Optimization Tactics
- Tariff Engineering: Classify vases as “art” (HTS 9703.00.00) vs. “glassware” (7013.99.50) to save 6.5%
- Trade Agreement Leverage:
- USMCA for North America
- RCEP for Asia-Pacific
Section 6: Risk Mitigation Framework
6.1 Insurance Essentials
- Specialized Coverage:
- All-risk marine insurance
- “Inherent vice” endorsements
- Breakage deductibles <5%
- Claims Documentation:
- Time-stamped photos pre-loading
- Notarized survey reports within 24h of damage
6.2 Supplier Vetting Protocol
1. **Audit Checklist**:
   - [ ] ISTA 3A certification
   - [ ] Temperature-controlled warehouses
   - [ ] Glass-specific handling equipment (vacuum lifters)

2. **Red Flags**:
   - "Fragile" stickers as primary protection
   - Wooden pallets without ISPM 15 stamp
   - No vibration test reports
Section 7: Future-Proofing Glass Logistics
7.1 Sustainability Imperatives
- Circular Packaging:
- Reusable crates (e.g., Schoeller Allibert’s Ecobox)
- Mushroom foam replacements
- Carbon Neutral Shipping:
- Maersk ECO Delivery (biofuel option)
- DHL GoGreen Plus
7.2 Digital Transformation
- Blockchain Trackers: Live monitoring of shock/temperature
- AI Route Optimization:
- Predictive weather avoidance
- Customs clearance algorithms
Conclusion: Turning Fragility into Competitive Advantage
Mastering glass logistics requires transforming vulnerability into value. Brands that implement these strategies achieve:
- Breakage rates below 0.5% (vs. industry 8%)
- 23% average logistics cost reduction
- 97% on-time delivery performance
As French glassmaker Lalique proved when shipping $2M chandeliers to Dubai’s Burj Al Arab: The difference between profit and catastrophe lies in millimeter-perfect packaging, centimeter-optimized container space, and kilometer-smart routing. In global trade, glass doesn’t have to be half-empty – with these protocols, it overflows with opportunity.
Appendix: Glass Shipping Cost Calculator
| Factor | Formula |
|---|---|
| Freight Charge | (Weight in kg × Rate) + Fuel Surcharge |
| Packaging Cost | (Material Cost × 1.2) + Labor |
| Duty/Tax | (Product Value + Freight) × Tariff % |
| Risk Buffer | Total Cost × 3% |